apt4Stats: Set of 7 PowerPoint Presentations on Probability for GCSE Statistics


From £13.50 ex VAT
If you are a school/college and would like to place an order and be INVOICED later, please email sales@apt-initiatives.com.
This set of 7 PowerPoint Presentations, written by a highly experienced teacher (of 25+ years), senior examiner and reviser for Maths and Stats examinations, are designed for use by:
- any teacher – not necessarily a maths specialist – as part of their own delivery of lessons.
- students working independently.
They can be used by:
- cover teachers.
- students who are unable to attend their lesson in person.
Each PowerPoint Presentation includes:
- Lesson objectives
- Step-by-step explanations of the subject matter
- Examples to aid understanding
- Questions to check understanding
- Answers to questions, with explanations
- Suggestions regarding which topic(s) should be moved on to next.
Product Information
This set of 7 PowerPoint Presentations (101 slides, excluding Title Pages) covers the following topics relating to ‘Probability’:
- 01 Introduction – Terminology & Values (9 slides): Reviews probability terms and explains the range of probability values.
- 02 Simple Probability (14 slides): Explains how to calculate simple probability, what is meant by ‘mutually exclusive’ and how to calculate the probability of something NOT happening.
- 03 Expected Outcomes & Relative Frequency (14 slides): Explains how to calculate the number of times you expect something to occur, how to express relative frequency as an estimate for probability, and how to look out for bias.
- 04 Outcomes (19 slides): Explains how to document outcomes for single and multiple events using listing or two-way tables or possibility space diagrams, and how to summarise outcomes using frequency trees and two-way tables, as well as how to calculate the number of combinations or arrangements of objects in different situations.
- 05 Tree Diagrams, OR and AND (16 slides): Explains how to create and use tree diagrams, what is meant by ‘dependent’ and ‘independent’ events, and the formulae for the ‘OR’ and ‘AND’ rules.
- 06 Venn Diagrams, Set Notation & Conditional Probability (20 slides): Explains set notation, how to create and use Venn Diagrams and (for higher tier students) how to find conditional probability.
- 07 Probability Distributions (19 slides): Explains discrete uniform distributions, binomial distributions, Pascal’s triangle, and how to expand and use (p + q)n to calculate probabilities.
These PowerPoints are one of 4 sets of PowerPoint Presentations that APT Initiatives Ltd has published to support teachers and students of GCSE Statistics. Other sets concern:
- Collecting Data
- Representing Data
- Analysing Data
Download Sample Material
apt4Stats PowerPoint on Probability - Introduction - Terminology and Values
Feedback
Related products
-
apt4Maths: Set of 14 PowerPoint Presentations (Relating to Algebra) on Equations and Inequalities for GCSE (and Key Stage 3) Mathematics
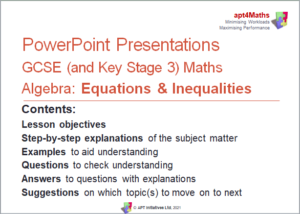 From £23.50 ex VAT
-
apt4Maths: Set of 7 PowerPoint Presentations (Relating to Statistics) on Analysing Data for GCSE (and Key Stage 3) Mathematics
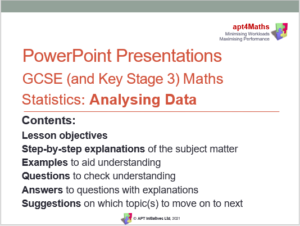 From £15.00 ex VAT
-
apt4Maths: Set of 10 PowerPoint Presentations (Relating to Geometry and Measures) on Symmetry Transformations and Vectors for GCSE (and Key Stage 3) Mathematics
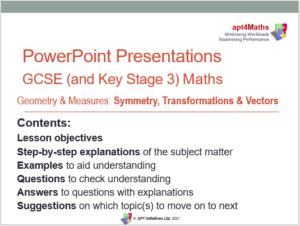 From £16.50 ex VAT
-
apt4Stats: Set of 14 PowerPoint Presentations on Analysing Data for GCSE Statistics
 From £29.50 ex VAT